As we enter an uncertain period for the Indian toll road market, it is important to look back to the past to see what occurred when the nation’s economy had been rocked.
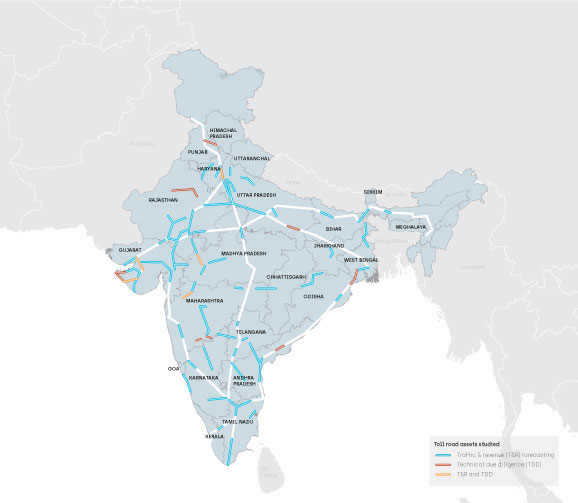
Since our Delhi office opened in 2016, we have studied more than 100 toll road assets in India. Traffic and revenue forecasting for toll roads has always been Steer’s core strength and this was our primary objective when the company decided to focus on the Indian market. With nearly 500 individual operational toll roads in India, each of approximately 100km in length, and a broadly equal split between government-owned and under concessions, the market was immense. Little did we know that we would have to relearn a lot of what we had been doing for nearly 35 years all over the world.
The toll road market in India had gone through one cycle of boom and bust in the period 2007/8 to 2011/12 and a new government had come in, which was starting to focus on restarting the infrastructure investment programme, with emphasis on road investment. There was, and still remains, a lot of stress in the existing assets under concessions. During the boom cycle, various bidders (developers as they are called in India) had been over-optimistic with their traffic projections. The National Highway Authority of India (NHAI) - primary grantor of these projects - had underestimated the hurdles it would face in getting the necessary clearances. In particular, land availability was a key bottleneck, and public banks lending to these projects had not carried out much due diligence to understand the risks involved. In summary, whatever could go wrong, went wrong.
This created an opportunity for some new age investors such as international pension funds and infrastructure-focused funds, who had started to look at the Indian market. This continues to be the case, as the domestic lending institutions are still under significant stress. These new investors needed a more rigorous assessment of the revenue and cost risks that they were taking on when investing in such assets.
Having worked with most of these investors elsewhere in the world, we understand what their investment committees want to know when considering investment in Indian toll roads. Our promise to them was and continues to be – we will deliver the same quality of service and products here in India as we have done all over the world. Easier said than done!
Below are key findings we have collated over the past four years after working on more than 100 toll road assets:
- Every year is a shock year: This could not be truer now more than ever, with the entire country in lockdown mode, and the tolling on national highways being suspended for 21 days due to Covid-19. With demonetisation (ban on 85% of currency in circulation) in 2016, introduction of a new national good and services tax (GST) in 2017, change in axle load norms (allowing new and existing trucks to carry 25% more loads) in 2018 to the significant slowdown in the wider economy leading to collapse of truck sales (partly linked to a liquidity crunch created by failure of a major shadow bank) in 2019 – no year is a normal growth year in India. Good news is, traffic bounces back quickly as new travel patterns emerge.
- Data isn’t always what you expect it to be: With various levels of maturity of reporting standards, understanding what the traffic and revenue data available from toll plazas actually means can be a challenge in itself. In addition, the inability of toll operators to explain the errors/issues in the data, or any specific historical events, makes it even more difficult to forecast such similar events in the future.
- Traffic times Toll Rates does not equal Revenue: Ticket prices vary, which means not all traffic users pay the full (or single) toll rates, and a significant proportion of light vehicles are exempted. In certain cases, the toll operator provides concessions not mandated in the concession agreement to certain local users as a pragmatic approach to revenue maximisation. Understanding only traffic growth is not enough in the Indian context. How the ticket types, trip frequencies and trip rates change in future years will also impact revenue growth.
- Trucks generate nearly 70% of revenues: Toll rates for large trucks are nearly 4.5 times toll rates for cars. The inter-urban nature of toll road network, and significantly higher trip lengths of trucks, means that they generate the majority of the revenues on toll roads. As a large proportion of India’s population has no car ownership, the car ownership levels, (<100 per 1000 people) are relatively low as compared to developed markets and, more importantly, long distance (>100km) travel by car is still a small proportion of the overall travel market.
- GDP growth remains a key driver of traffic growth: However, understanding commodity drivers and their linkages with GDP growth becomes a key aspect of forecasting. Agricultural-focused commodity corridors are growing half as fast as GDP, whereas industrial or port-focused commodity corridors are seen to grow at a similar pace to GDP.
- Network impacts are big drivers of growth compared to GDP: As the country expanded the network from 5,000km to 50,000km from the 1990s to the 2010s, the availability of alternate/feeder routes has become a key determinant of traffic growth or decline. Wide variation in year-to-year traffic growth has been observed on various toll roads, as new alternates or feeder corridors have emerged. Aggressive plans and progress with new expressways show the potential to provide a much-improved level of service, apart from changing the network behaviour in new and unseen ways. A clear understanding of how the network is evolving becomes a key input into developing forecasts for any toll road section.
- Regulatory changes can have significant influence on demand: Regulatory changes have come about thick and fast. From bans on specific mining commodities (coal, sand, iron) to changes in overloading penalties for trucks, to introduction of compulsory use of electronic tolling (FasTAG), which result in significant shifts in truck flow patterns and the yields at individual plazas.
- Small variations in GDP could mean large variations in traffic growth: Due to the elastic nature of truck traffic growth, small variations in GDP growth results in a significant variation in truck traffic growth. In the growth period when GDP is faring well at around 6-7% growth rates, traffic is seen to increase at 10-12% growth rates. However, when the GDP slows down to a 4-5% growth rate, traffic is seen dropping down to 0% or even negative growth rate, particularly in industrial corridors. The variation is relatively smaller on agricultural corridors.
As ever, traffic and revenue forecasting remains a challenge, even more so in a dynamic economy as India. The lessons we have learnt here, help us deliver more informed views to the investors in order to assess the risks involved in such investments. Each project risk brings its own flavour. While we believe this is an industry where we will be learning every year, the added knowledge we have built upon yearly, make us well poised to face these challenges in the future, We look forward to continuing on this learning curve, and being part of the transformation that the toll road market in India is going through.